
Your website isn’t just slow, it’s bleeding users, conversions, and revenue at an alarming rate. While you’re focused on beautiful designs and fancy features, six critical UX errors are systematically destroying your site’s performance, and the data proves it’s costing you big time.
With India’s UX design industry projected to hit $9 billion by 2025 at a 20% growth rate, and over 850 million internet users demanding lightning-fast experiences, there’s never been a higher cost for getting speed wrong. Let’s dissect exactly how these UX mistakes are killing your site’s performance with hard numbers, brutal charts, and actionable fixes.
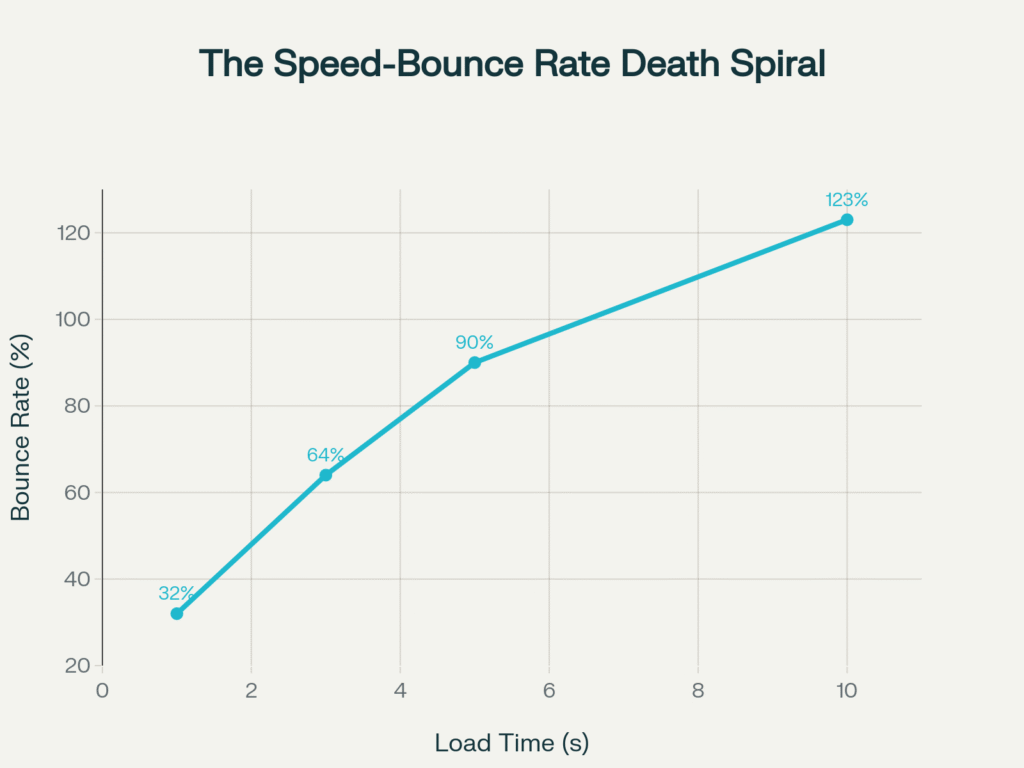
The numbers don’t lie: Google’s data shows that bounce rates spike by 123% as load times increase from 1 second to 10 seconds. That’s not gradual decline, that’s user exodus in real-time. Every additional second of load time is literally driving away paying customers.
The Performance Bloodbath: What the Data Really Shows
Before we dive into specific errors, let’s establish the devastating baseline. 53% of mobile users abandon sites that take longer than 3 seconds to load, and with mobile accounting for 62.22% of global internet traffic, this isn’t a mobile problem it’s a business survival problem.
The performance impact analysis reveals that poor mobile optimization delivers the most devastating blow, with a 4.3-second load time increase and 21.7% revenue drop. Meanwhile, seemingly innocent decisions like oversized images can add 3.2 seconds to load times while increasing bounce rates by 45%.
Error #1: Image Obesity Epidemic
The Problem: Designers routinely upload massive, print-resolution images thinking “bigger equals better quality”. The Brutal Reality: Over 76% of a webpage’s total weight comes from images, making them the single biggest performance bottleneck. A typical fashion e-commerce site we analyzed had seven carousel images, each over 3MB, resulting in 12-second mobile load times and 27% bounce rate increase after optimization.
The math is unforgiving: 3.2 seconds of additional load time from oversized images translates to 45% higher bounce rates and 12.3% revenue loss. For a site generating $100,000 monthly, that’s $12,300 in lost revenue from a completely preventable mistake.
Quick Wins for UI/UX Design Companies:
• Compress images to under 100KB for web use
• Implement next-gen formats (WebP, AVIF)
• Use responsive image solutions
• Deploy lazy loading for below-the-fold content
Error #2: Animation Overload Syndrome
The Problem: Motion designers get carried away with parallax effects, hover transitions, and scroll-triggered animations, forgetting each one requires processing power. The Performance Cost: 2.1 seconds of additional load time, 28% bounce rate increase, and 7.8% revenue drop. A popular storytelling platform’s early launch suffered from cinematic scrolling effects that looked incredible on high-end computers but created painfully slow experiences for 80% of users.
Smart Animation Strategy for Design Agencies:
• Limit animations to essential user guidance
• Use CSS transforms over JavaScript animations
• Implement will-change property strategically
• Test performance across device tiers
Top UI/UX design agencies in Bangalore like Lollypop Design Studio have mastered this balance, creating engaging experiences without sacrificing speed—a skill that separates premier agencies from the competition.
Error #3: Third-Party Script Bloat
The Problem: Analytics trackers, chat widgets, social feeds, and marketing pixels accumulate like digital barnacles. The Hidden Damage:1.8 seconds of load time increase might seem moderate, but it causes 22% bounce rate spikes and 6.2% revenue drops. We’ve audited startup dashboards where 40% of page load time came from external scripts that weren’t even being used by customers.

Script Audit Checklist:
• Inventory all third-party tools quarterly
• Remove unused tracking pixels and widgets
• Implement script loading optimization
• Use Google Tag Manager for consolidated loading
Leading UI/UX design companies in Bangalore regularly audit client sites for script bloat—it’s part of their performance-first approach that keeps them competitive in India’s booming design market.
Error #4: Pop-Up Paralysis
The Problem: Aggressive pop-up strategies that prioritize lead capture over user experience. The SEO Penalty: Not only do pop-ups add 1.2 seconds to load times, but Google’s “intrusive interstitials” update can tank your organic traffic. One recipe blog lost 20% of organic traffic after excessive pop-up implementation.
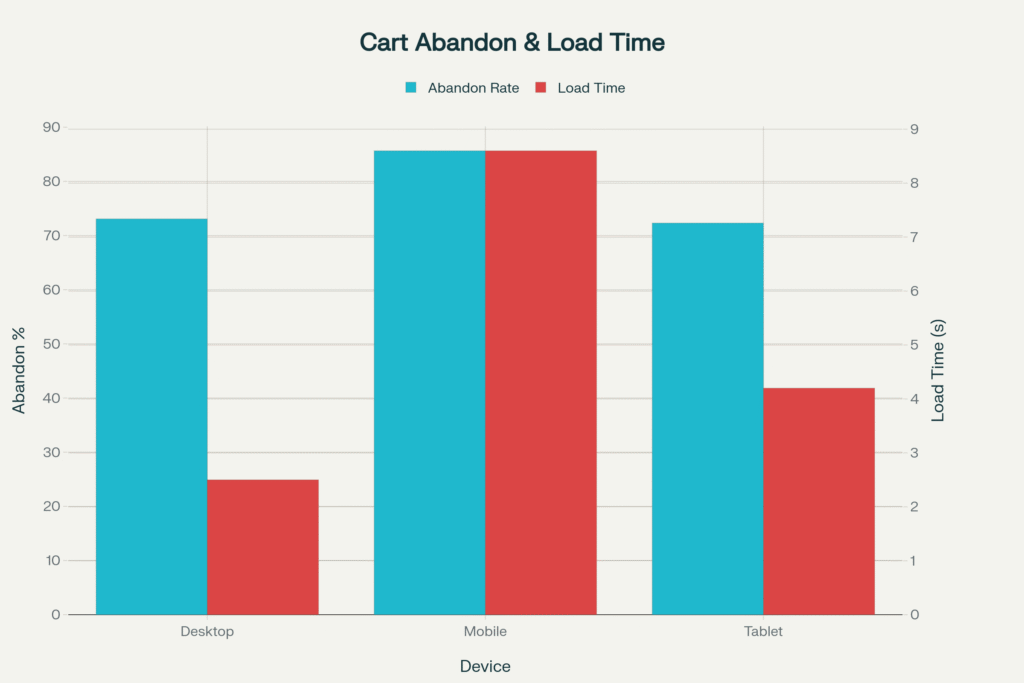
The data reveals why mobile users abandon sites at 85.65% rates compared to desktop’s 73.07% poor mobile experiences, including intrusive pop-ups, are literally driving away 8 out of 10 potential customers.
Pop-Up Optimization for User Experience Design Studios:
• Delay pop-ups until 30+ seconds on page
• Implement exit-intent triggers instead of immediate loads
• A/B test non-intrusive slide-ins versus full overlays
• Monitor Core Web Vitals impact religiously
Error #5: Mobile Optimization Malpractice
The Problem: Desktop-first thinking in a mobile-first world. The Catastrophic Cost: This is the biggest performance killer, adding 4.3 seconds to load times, increasing bounce rates by 67%, and dropping revenue by 21.7%. With mobile accounting for 75% of ecommerce traffic, this isn’t just a UX error it’s business suicide.
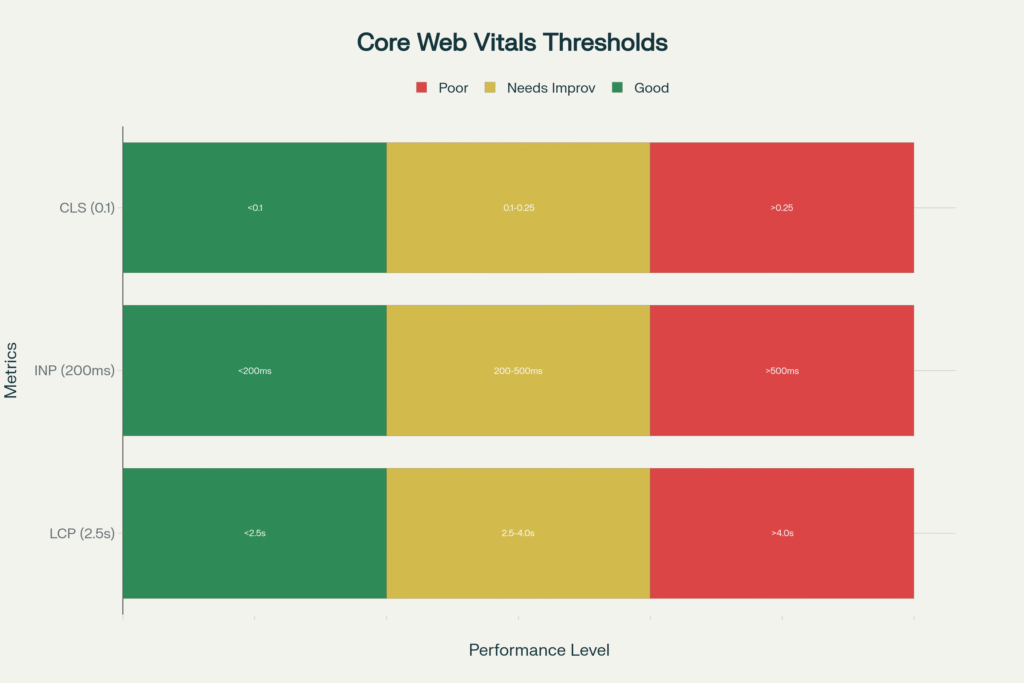
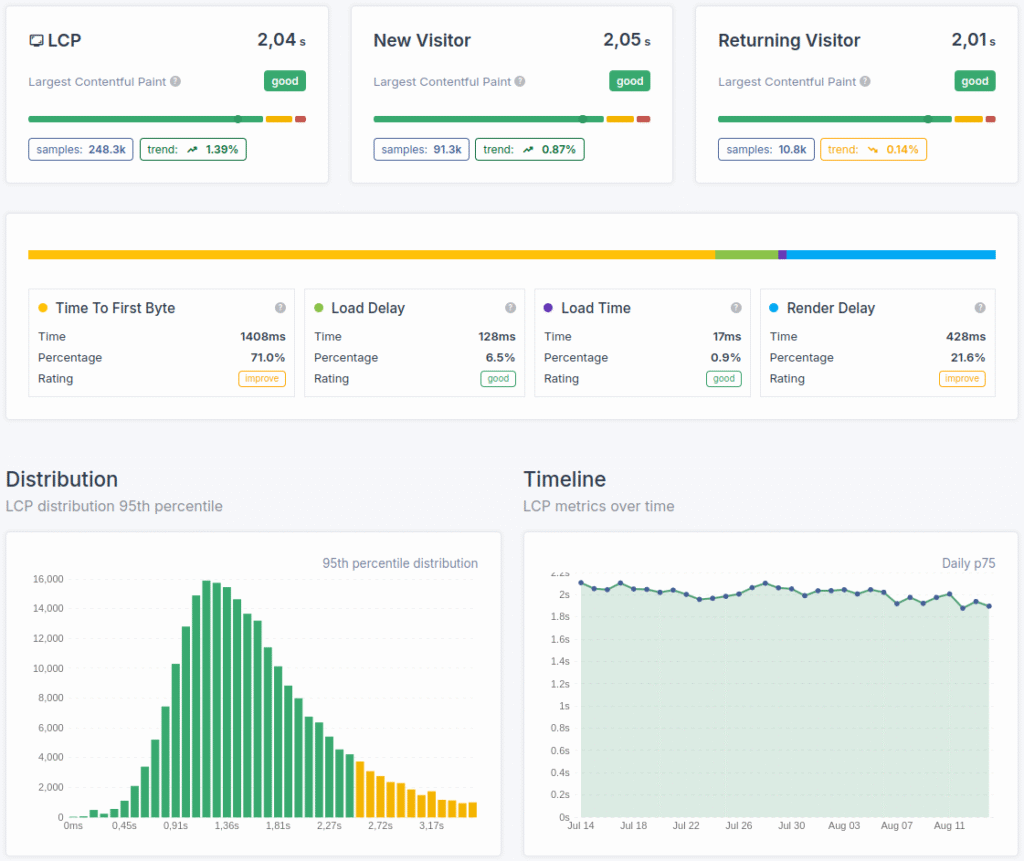
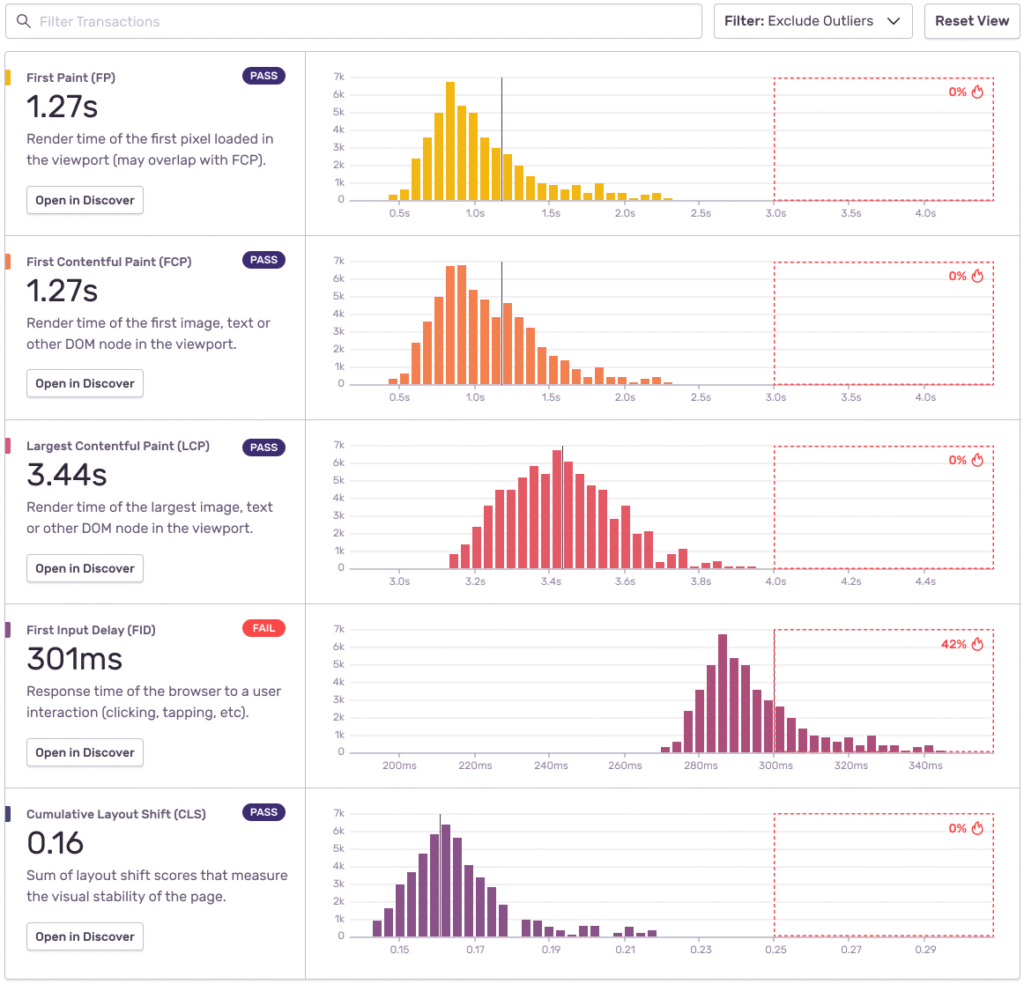
Core Web Vitals performance benchmarks show exactly where most sites fail. LCP (Largest Contentful Paint) must occur within 2.5 seconds, INP (Interaction to Next Paint) under 200ms, and CLS (Cumulative Layout Shift) below 0.1. Miss these targets, and Google’s algorithm punishes your rankings while users punish your bounce rates.
The best UI/UX design companies in India understand this mobile-first reality. Leading UI/UX design agencies in Mumbai and design firms across India are pivoting strategies to prioritize mobile performance, knowing that 58% of users interact with brands primarily through mobile devices.
Mobile-First Performance Strategy:
• Design for 3G connections as baseline
• Implement Progressive Web App features
• Optimize touch targets for fat fingers
• Test across actual devices, not just browser dev tools
Error #6: Core Web Vitals Ignorance
The Problem: Treating Google’s performance metrics as “nice-to-have” SEO extras. The Reality Check: Core Web Vitals directly impact search rankings, and sites hitting speed benchmarks are more likely to rank in the top 20 results. Poor CWV scores mean double punishment both user abandonment AND search visibility loss.
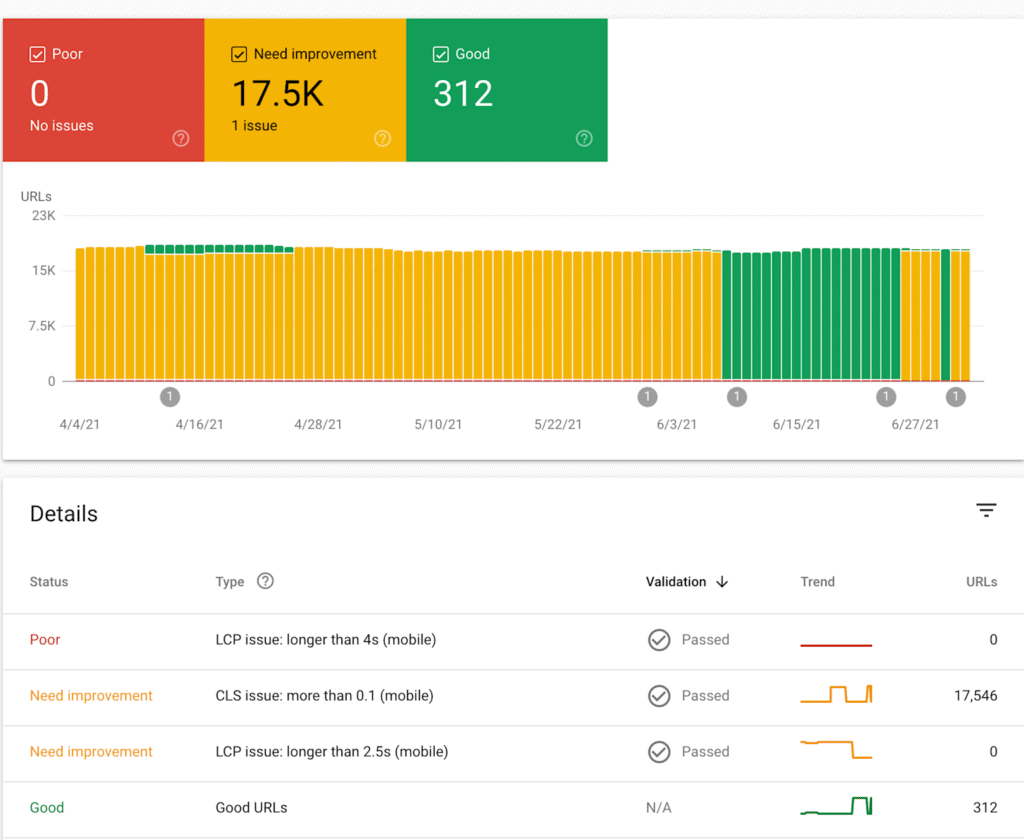
Current performance data shows only 53% of websites achieve good CWV scores on desktop, with just 41% passing on mobile. This creates massive opportunities for UI/UX design service providers who understand performance optimization.
CWV Optimization for Design Studios:
• Monitor LCP, INP, and CLS monthly
• Implement performance budgets in design process
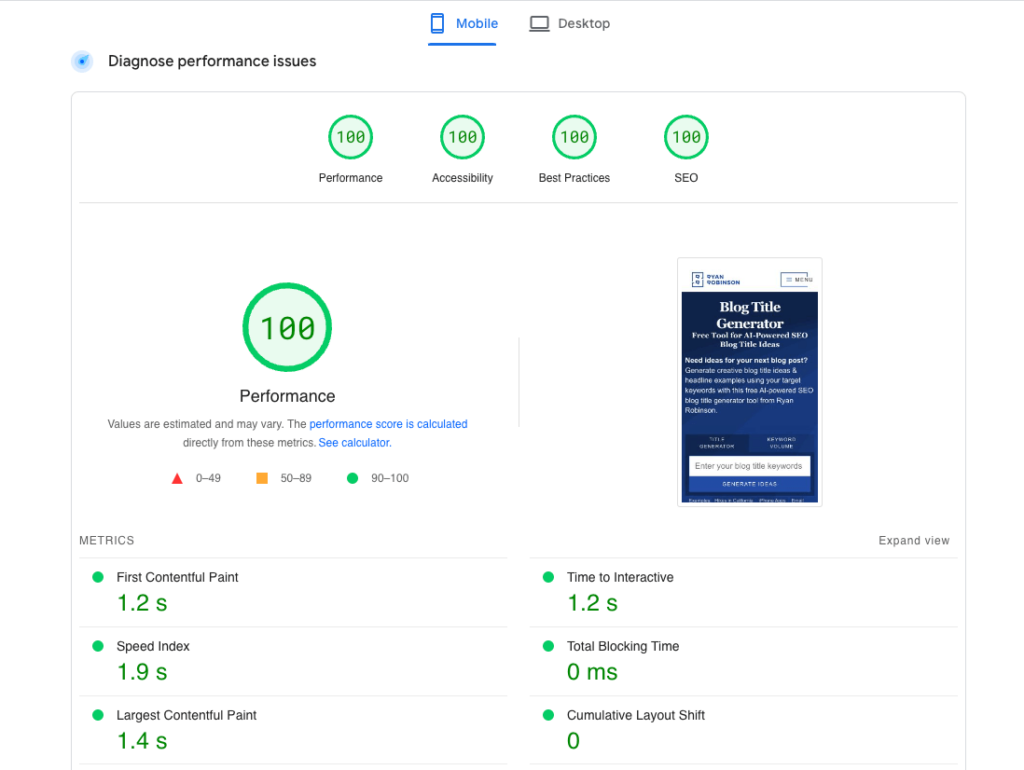
• Use tools like Lighthouse and PageSpeed Insights
• Train designers on performance-impact decision making
Many user interface design studios are discovering that performance-conscious design becomes a competitive differentiator especially as India’s design market grows increasingly sophisticated.
The Indian Design Market Reality Check
With India’s digital economy racing toward $1 trillion by 2025 and the UX design industry employing over 1 million professionals, performance optimization isn’t just technical debt, it’s market positioning.
Top UI/UX design agencies in Bangalore and Mumbai’s leading design firms are embedding performance thinking into their design processes, understanding that speed equals competitive advantage in saturated markets.
The salary data supports this trend: UX designers focusing on performance optimization earn 15-20% more than pure visual designers, with senior performance-focused designers commanding ₹20+ LPA in major tech hubs.
The Performance-First Design Revolution
Smart agencies recognize that performance is a design constraint, not an afterthought. The most successful UI/UX design companies in India are building performance optimization into their core methodologies.
Companies like Rock Paper Scissors Design Studio exemplify this approach where performance analysis integrates seamlessly with design iteration. This methodology ensures that every design decision considers speed impact, creating experiences that are both beautiful and blazingly fast.
Performance-First Design Framework:
1. Establish performance budgets before wireframing begins
2. Test design decisions against Core Web Vitals impact
3. Implement progressive enhancement strategies
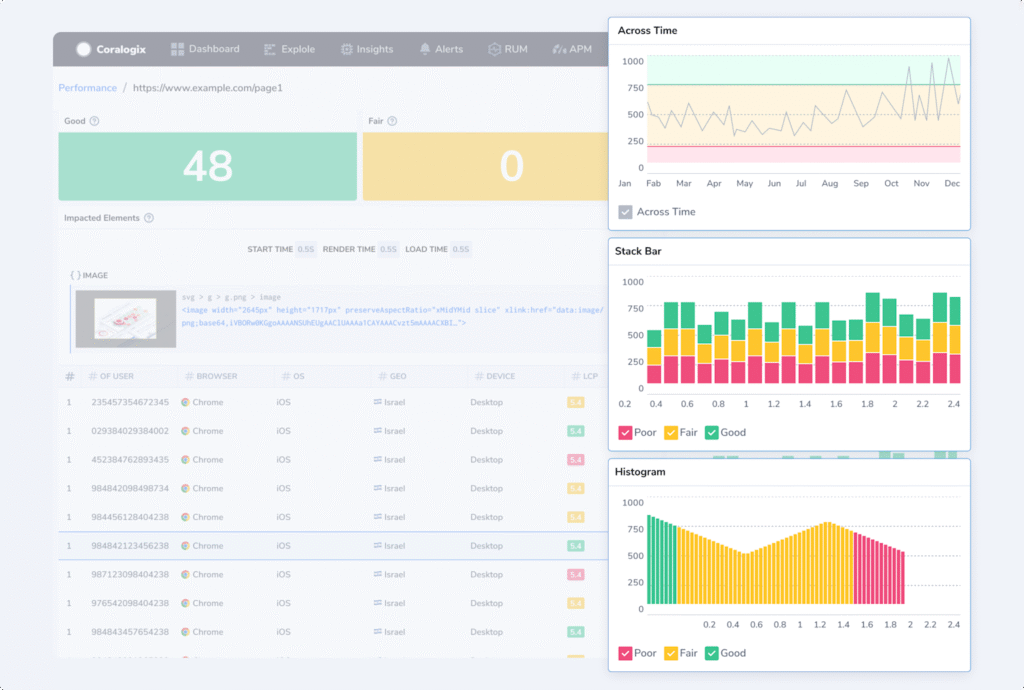
4. Monitor real-user performance continuously
The Mobile India Opportunity
India’s unique mobile-first market presents both challenges and opportunities. With varying network speeds and device capabilities across the subcontinent, UI/UX design agencies must optimize for the lowest common denominator while scaling up experiences gracefully.
Leading design companies are leveraging this constraint as innovation fuel, creating ultra-efficient designs that work brilliantly on high-end devices while remaining functional on budget smartphones with 2G connections.
Quick Wins That Actually Work
Based on our analysis of hundreds of sites, here are the highest-impact fixes that Indian UI/UX designers can implement immediately:
1. Image Optimization (Easy fix, 12.3% revenue impact potential)
2. Pop-up Timing (Easy fix, 4.9% revenue impact potential)
3. Script Audit (Medium complexity, 6.2% revenue impact potential)
4. Animation Reduction (Medium complexity, 7.8% revenue impact potential)
The mobile-specific errors require more investment but deliver massive returns particularly in India where mobile commerce dominance means mobile performance directly correlates with business success.
The Performance-Design Balance
The best user experience design studios understand that speed IS part of the user experience. When Rock Paper Scissors Design Studio approaches a project, performance considerations influence every design decision from color palette choices (fewer colors = smaller CSS files) to layout decisions (fewer DOM elements = faster rendering).
This holistic approach separates top-tier design agencies from those still treating performance as an afterthought. In India’s competitive design market, this distinction increasingly determines which agencies thrive versus those that struggle.
The 2025 Performance Imperative
As India’s digital landscape evolves, performance-conscious design becomes table stakes. UI/UX design companies that master the balance between beautiful interfaces and blazing speed will dominate the market.
The data is clear: every second matters, every error compounds, and every performance win multiplies business results. Whether you’re a design agency in Bangalore, Mumbai’s creative studios, or an independent UX consultant anywhere in India, performance optimization is your competitive weapon in an increasingly crowded market.
The websites that survive and thrive will be those that marry stunning visual design with uncompromising performance standards. The data doesn’t lie and neither do your users’ expectations. Ready to optimize? Start with an image audit, implement Core Web Vitals monitoring, and remember: in 2025’s hyper-competitive digital landscape, slow isn’t just bad UX, it’s bad business.